Benchmarking Annual Fund Results
 One of the best ways to assess your annual fund performance is through institutional benchmarking. In other words, compare the results of your program to the results seen at other schools. A very general way to benchmark is to look at the overall industry trends that take into account a large sampling of other institutions. The problem with this approach is that, with so many different types of institutions out there, you don’t always have meaningful points of reference.
For example, if your institution has a 5 percent alumni participation rate and you compare it to the median national rate of 8.3 percent, then you might infer that your program is not doing well. But beware. You may be jumping to inaccurate conclusions since you’re including a lot of different types of institutions in your comparison.
To get a clear apples-to-apples idea of how your program stacks up, you’ll have to compare your program to ones at institutions that look and act like yours. If you’re a small liberal arts college with 5,000 alumni and are interested in knowing if you have a sufficient number of calling stations in your call center, it’s not going to be helpful to compare your program to one at a large public university with 300,000 alumni. Instead, you’ll want to identify a peer group or cohort of between five to 15 programs that resemble your institution in terms of size, mission, and academic offerings.
Once you’ve established a peer group, you’ll need to determine which metrics you want to benchmark. Consider organizational characteristics of each program (e.g., number of annual giving staff, budget), key performance metrics (e.g., alumni participation rates, retention rates), and strategic aspects such as the criteria used to account for annual fund revenue and the way staff are deployed to focus on leadership annual fund gifts.
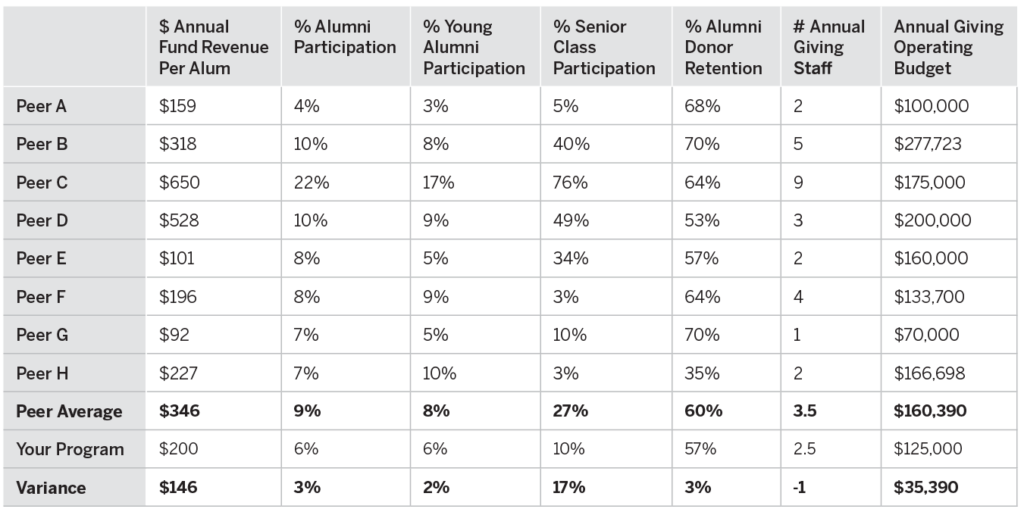
Next, you’ll want to collect the data. Depending on the scope of your benchmarking goals, you may wish to gather data yourself by reaching out to colleagues directly, or you may decide to hire a firm or consultant to conduct the study on your behalf. It will help to create a matrix to record and organize information (see the figure below). This will make it easier to organize and analyze the data and ultimately to determine where your program’s characteristics and outcomes are strongest and where you have the greatest opportunities for adjustments, improvements, and investments compared to peer institutions.
When you’re able to put your program’s results into context, they highlight the elements that need attention. Assuming nothing disruptive has occurred (e.g., staff turnover, problem at the mail shop, economic downturn), the vast majority of your program’s parts will typically operate and perform the way you expect them to. But when your analysis helps to identify a trend or an outlier—either a positive or a negative one—it gives you an opportunity to act on it, to make changes and improvements. Doing so is being strategic and data-driven.
______________
This article has been adapted from the book Ideas for Annual Giving by Dan Allenby. Copyright (c) 2016 Council for Advancement and Support of Education. All rights reserved. Used by permission.
AGN Members receive unlimited access to our resources, discounts, and other benefits. Click here to learn more.
Want to stay up-to-date on best practices in annual giving? Click here to follow AGN's Page on Linkedin!